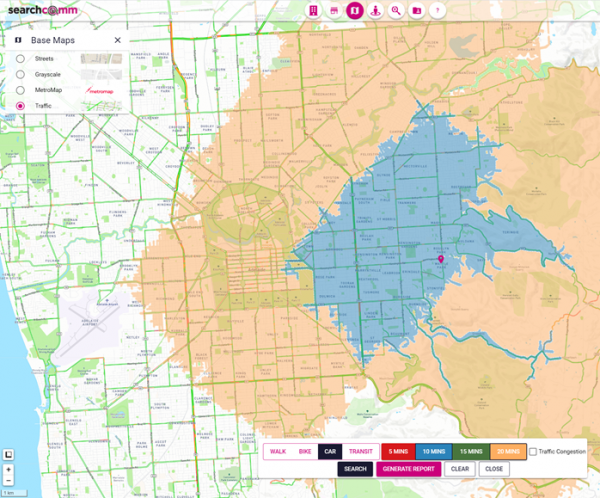
Drive Time Analysis is a feature designed to help you understand the accessibility to a particular location. You can use it to visualize coverage areas or catchments in terms of travel times.
The drive time buffers (the shaded areas on the map) are created from a starting or centre point and you can be set run at 5, 10, 15 or 20 minutes.
Your analysis can consider different travel modes (not just car) including walking, bike or public transport. We have also added a feature to review the impacts of traffic congestion during peak periods.
For example, a new office location may regard public transport accessibility as a priority whereas a logistics operator may seek to test traffic congestion impacts to/ from the airport.
If you need further detail about the catchment area, a report can be then generated which details key demography, building activity and real estate listings information.

